

If you’re a happy Myposeo user, it’s no secret that one of the key features of our platform is the collection of your keyword positions in Google’s SERPs (Search Engine Result Pages).
Once the positions have been collected, we calculate a range of Key Performance Indicators (KPIs) including the Average Position, which is supposed to represent the performance of your site in the search engine.
The Average Position, which is interesting, is however not representative enough when you want to analyse the evolution of visibility on several expressions, for the simple reason that it does not include in its calculation the users’ demand for the keywords concerned, represented by the Monthly Search Volume. Losing or gaining positions on keywords with low or high search volume will not have the same impact on your performance.
With this in mind, we have created and developed a customised position indicator to which we integrate the keyword search volumes: W.A.R. Weighted Average Ranking.
Let’s get to the heart of the matter with a small sample of keyword queries and positions that will illustrate how the W.A.R metric works:
1 – The Average Position has limits
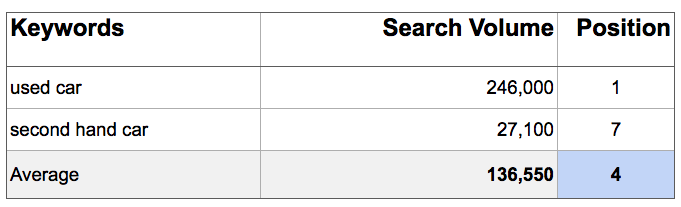
Tab 1 : Let us take the example of two queries with their respective search volumes ((volume for information only), their positions in the SERP and the Average Position of the two queries. So far, nothing crazy, an Average Position of 4, and so much the better, the domain is 1st on the “used car” query with the largest SV (Search Volume).
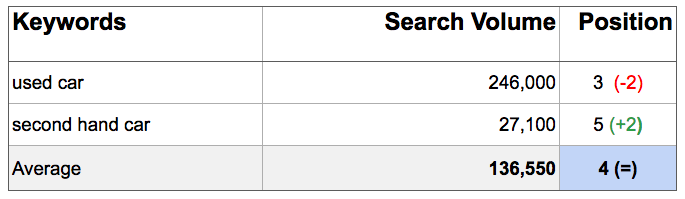
Tab 2 : 1 week later, the positions moved. The site loses two positions on the very high volume request, gains two on the request with almost 10x less volume. The Average Position does not move… and you can see the concern of the indicator.
2 – Integrate the search volumes into the Position
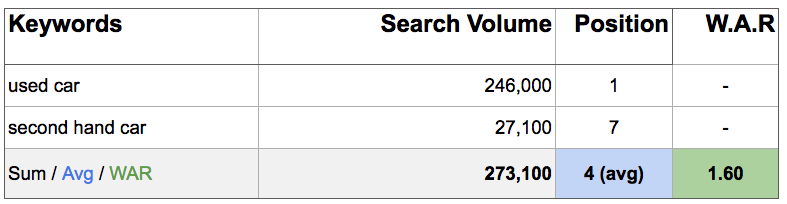
Let us now add to the tables the Weighted Average Position, the formula is as follows:
sum(Average Volume*Position)/sum(Average Volume) = W.A.R
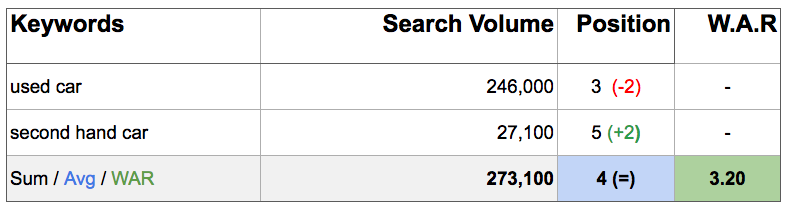
While the Average Position did not move despite the changes in position of the two queries, the WAR has decreased. It went from a WAR of 1.60 to a WAR of 3.20.
This decline is explained by the fact that a loss of two positions on a claim at 246,000 Volume has a much greater impact than a gain of two positions on a claim at 27,100. This is illustrated by the WAR by giving more weight in its calculation to fluctuations in high search volume keywords.
Please note, it is not uncommon to have significant variations in WAR when only 1 of your very high volume keywords, loses or gains positions or has just moved up to 78th place for example.
If we only followed the evolution of the Average Position, it would not have been possible to realise that the site was losing positions on high volume keywords. The WAR is there to remedy this shortcoming by offering a simple reading of this phenomenon.
3 – WAR and Global WAR
Important: In the context of our Performance Monitoring and Visibility Audit modules, the WAR is based on the search volumes of the keywords positioned. There is also the global WAR, which also integrates in its calculation, the search volumes of unranked keywords, which is explained below:
Let’s go back to our table and we are adding a new keyword to our performance tracking: “buy a used car”. Unfortunately your site is not positioned in the first 10 pages and we are sitting on a search volume query of 18,100.
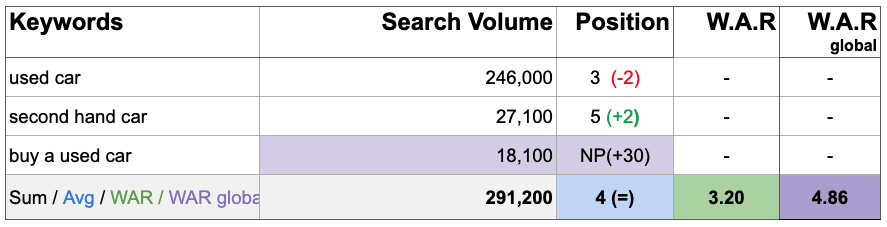
As described above, the WAR (3.20) will not take into account the “lost” volume of this unpositioned request (NP), whereas the global WAR (4.86) will include it in its calculation. It is fairly easy to see the value of the global WAR, which includes the volumes of all the keywords whose positions are tracked, whether ranked or not
Track and view these indicators in Myposeo
You’re going to tell me : “It’s all very well all these little tables with 3 keywords but where do I find these indicators in Myposeo and how to use them on large volumes of keywords monitored”.
I was just about to come to that. Our marketing team often promotes it during our webinars, Myposeo offers a module to create your own reports in addition to its data collection modules.
We are using information from the SEO Performance Tracking (position tracking) of 8,000 keywords for a major automotive brand whose positions are collected daily.
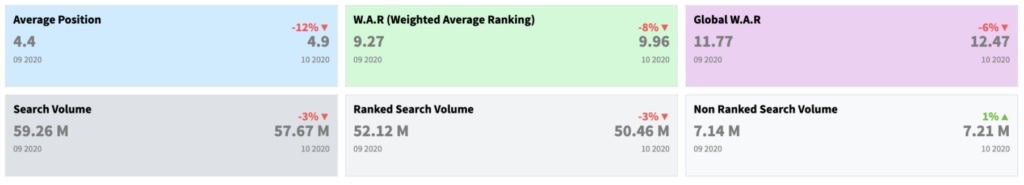
Below, some scorecards to compare the Average Position, the W.A.R., the Global W.A.R. and the volumes of ranked and unranked of the site. Even if the sites performance is doing well, there is still an opportunity for 7.14 million unranked Search volume out of 59 million represented by the all the keywords in the campaign.
Another example is the evolution of the Average Position Vs. WAR Vs. global WAR to assess its progression over time and the gaps between the 3 indicators. The objective is to have as little gap as possible between the WAR and the global WAR and to be as close as possible to 1.
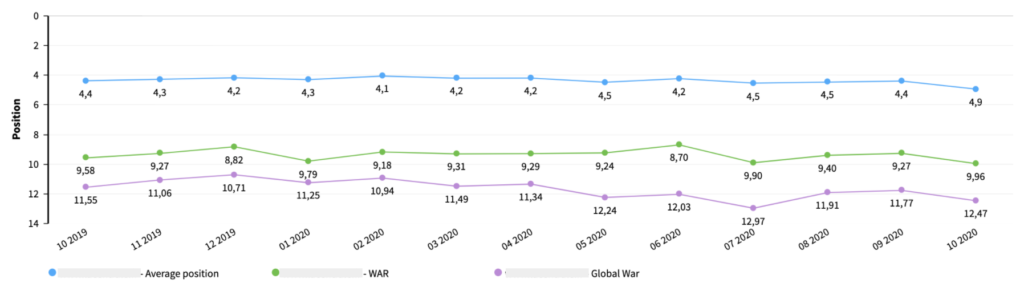
As WARs are closely linked to search volumes, it is interesting to be able to compare them directly to compare the seasonality of keywords and the performance of the site.
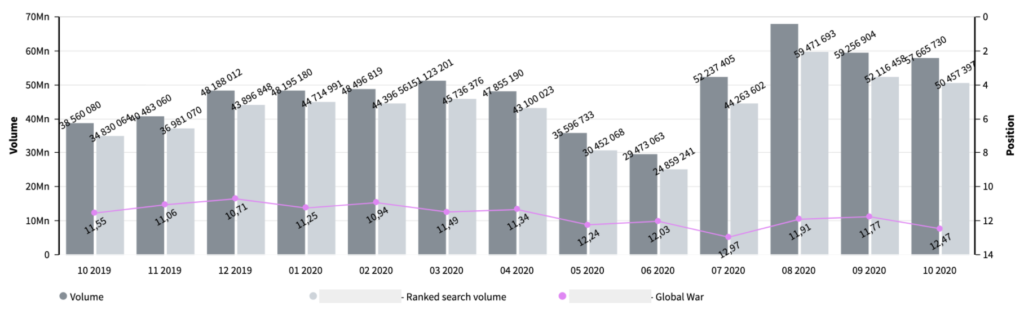
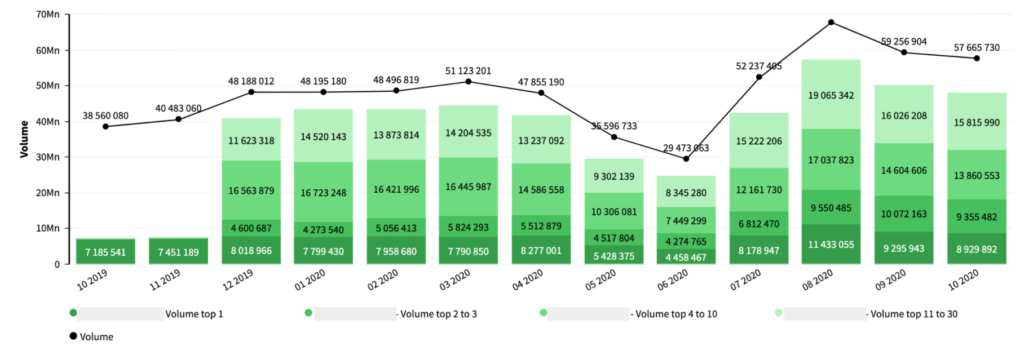
This graph shows the total search volume and the search volume for the keywords positioned + the global WAR curve.
The graph below indicates what position (1, 2 to 3, 4 to 10, etc…) collect the most search volume. To make it simple, the goal is to have a maximum of SV in the higher positions. This graph will also allow you to know who much search volume is missing beyond the 1st page of results for example.
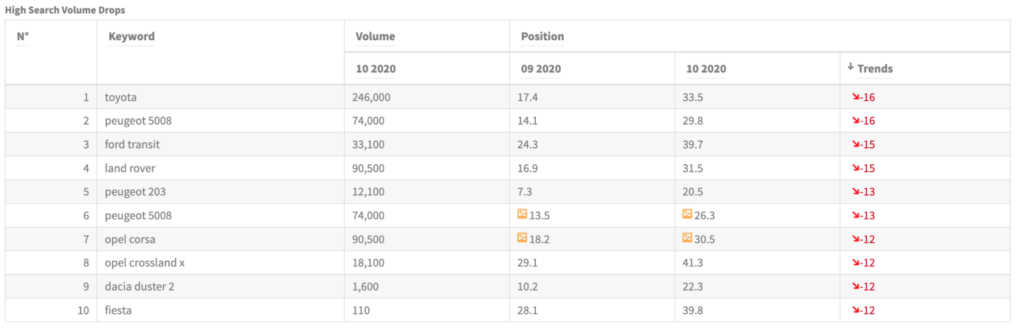
It is very good to see decreases or increases at a macro view and it is absolutely necessary to know the keywords that are impacted in order to be able to act. Here is a table in which are isolated, very high volume search queries that have lost positions, which lower the WAR.
Conclusion: Stop using the average position for SEO!
Practical tips:
- The Average Position alone is no longer sufficient to judge the impact of the up and down of positions on your so-called “real” visibility,
- It is important (essential?) to compare it with other indicators such as the WAR and even better the Global WAR to be alerted to major changes likely to impact your traffic.
- Pixel Ranking of keywords, which everyone agrees on and which can be complementary whilst also being weighted by volume (this is another topic for another article).
Without forgetting the quotation of our intern: “Basically, the better your site is positioned on high volume keywords, the better your WAR is and the better your traffic is”. Enough said!
I hope that this post will have aroused your curiosity and that you will create this report dedicated to the Weighted Average Position, available in your report template list. You will notice that it contains a few surprises that I have not mentioned here, notably that the WAR is calculated on your keyword groups, your page groups and your pages. For all your questions, we will be happy to answer you with our support.
See you soon.