
For more than 4 years now, myposeo has been in constant evolution and has tried hard to meet your expectations. For the past few months we have been working on numerous updates of security and databases to improve the use of the tool. The new v3.7 version, which is the largest update carried out since the merger of myposeo with the SEMvisu tool, was launched this Wednesday, November 12. This update affects mainly the SEO tracking tool which is evolving to become a genuine tool for tracking performance and search engine optimization visibility by going beyond rank tracking.
Let’s do a tour of the new features of the 3.7 update.
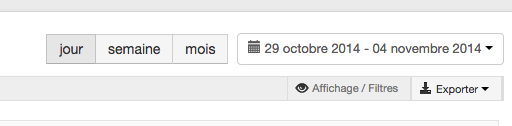
1- A new calendar
The first change to the 3.7 version is the structural reorganization of the calendar. You will now be able to analyse results with a more precise calendar. In the current version each view possesses its own calendar, making it necessary to re-enter your date to modify the scale of visualisation of your data. From now on, the calendar is independent and is applied to each view. So you can navigate freely from the synthesis to the rank while maintaining the chosen dates. This calendar also offers you the possibility of rapidly choosing a range of dates (7 days, 30 days, 1 month, etc.).
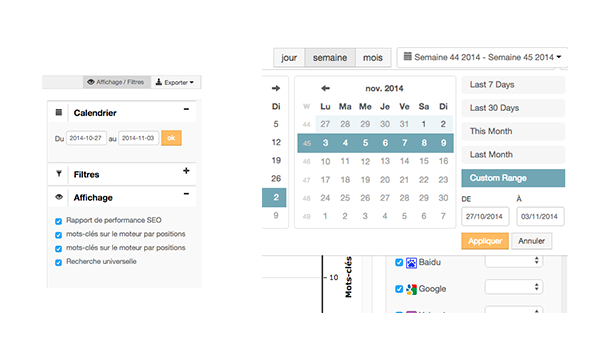
Data calculated by week and by month
This modification of the calendar is a very big change since it is now possible to display the data of your site by day, week, and month. For example, you can follow the evolution of the average position of your site over a week and myposeo will calculate and archive this data.
With this new calendar you now have fast access to consolidated data in a single click:
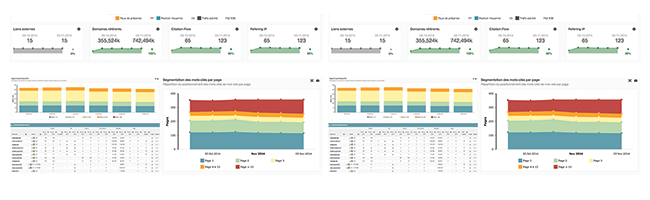
2- Complete modification of the synthesis
Revamped graphics
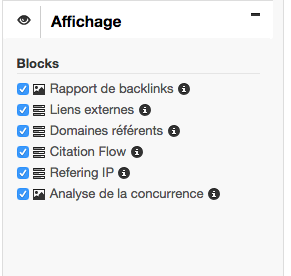
In order to have a faster view of the progression of the performance of your site, we have decided to reorganize and complete the synthesis. The graphics have been reviewed and have become more readable. The score cards of your indicators are accompanied by graphics of evolution and most of the visualizations can be customized (type of display). The page has thus gained in visibility.
Note that you can always modify the display of this synthesis in the right hand column, where you also have the possibility to consult the definition of each of the indicators.
Addition and modification of graphics
Also, to simplify the management of this page of syntheses we have chosen to separate the rank tracking and Netlinking data recuperated from Majestic SEO. This has thus enabled us to add interesting graphics and indicators for each of these sub-menus. In the new version you will find the addition of graphics, or more exactly, different visualizations of the same data as well as the possibility compare more data within a single visualization.
With regard to the graphics, we have preserved the visualizations and you will find all of those you had in the previous synthesis.
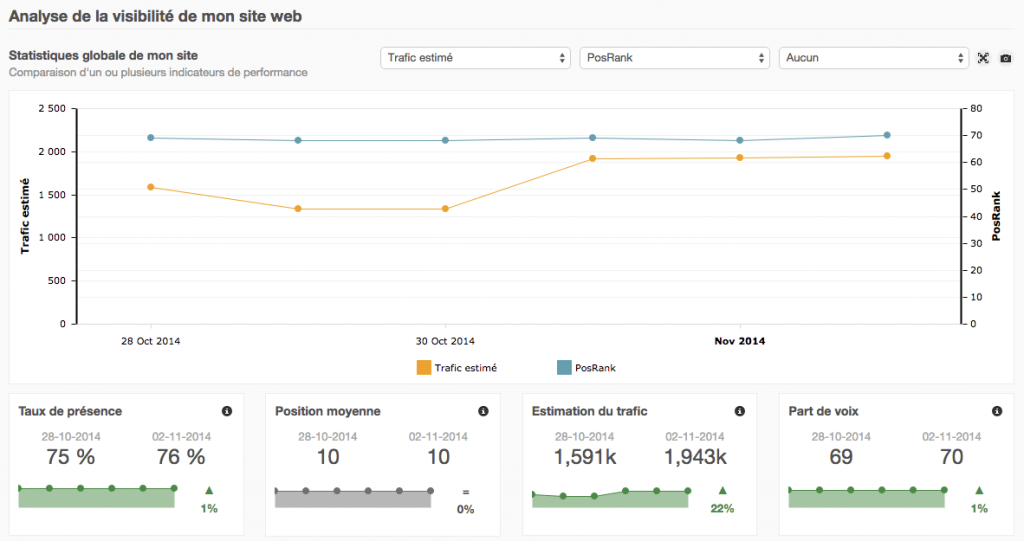
Addition of new indicators (KPI)
The v3.7 version was the occasion to review the storage and display of data and we therefore took advantage of it add some new indicators which had been frequently requested by our users:
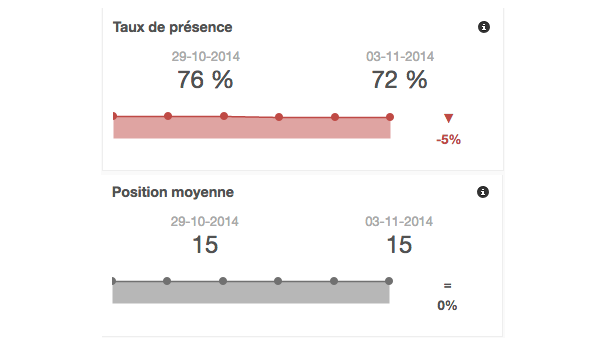
– the rate of presence
– the average position
The rate of presence allows you to know the percentage of visibility of a site by the keywords of the project. For example, out of 10 keywords, if 5 keywords are positioned in the first 10 pages of the search engine, this represents a rate of presence of 50 per cent. It is therefore an important indicator that will enable you to relativize the other indicators like PosRank.
The average position (of a site or keyword) is more explicit and displays a calculation of the average position obtained by your keyword or your group over period of a week or a month. This information has been added in order to keep the treatment of your data in Excel files to a minimum.
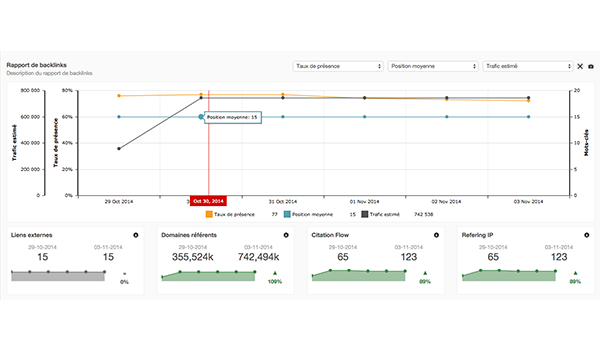
Within this segmentation, two KPIs have been added to the backlinks report. In addition to external backlinks and referring domains, you now have the Flow and the Referring IP. A definition of each indicator is available in the tab in the lower right. Other indicators will arrive later to allow you to make an even more complete syntheses of your netlinking tracking.
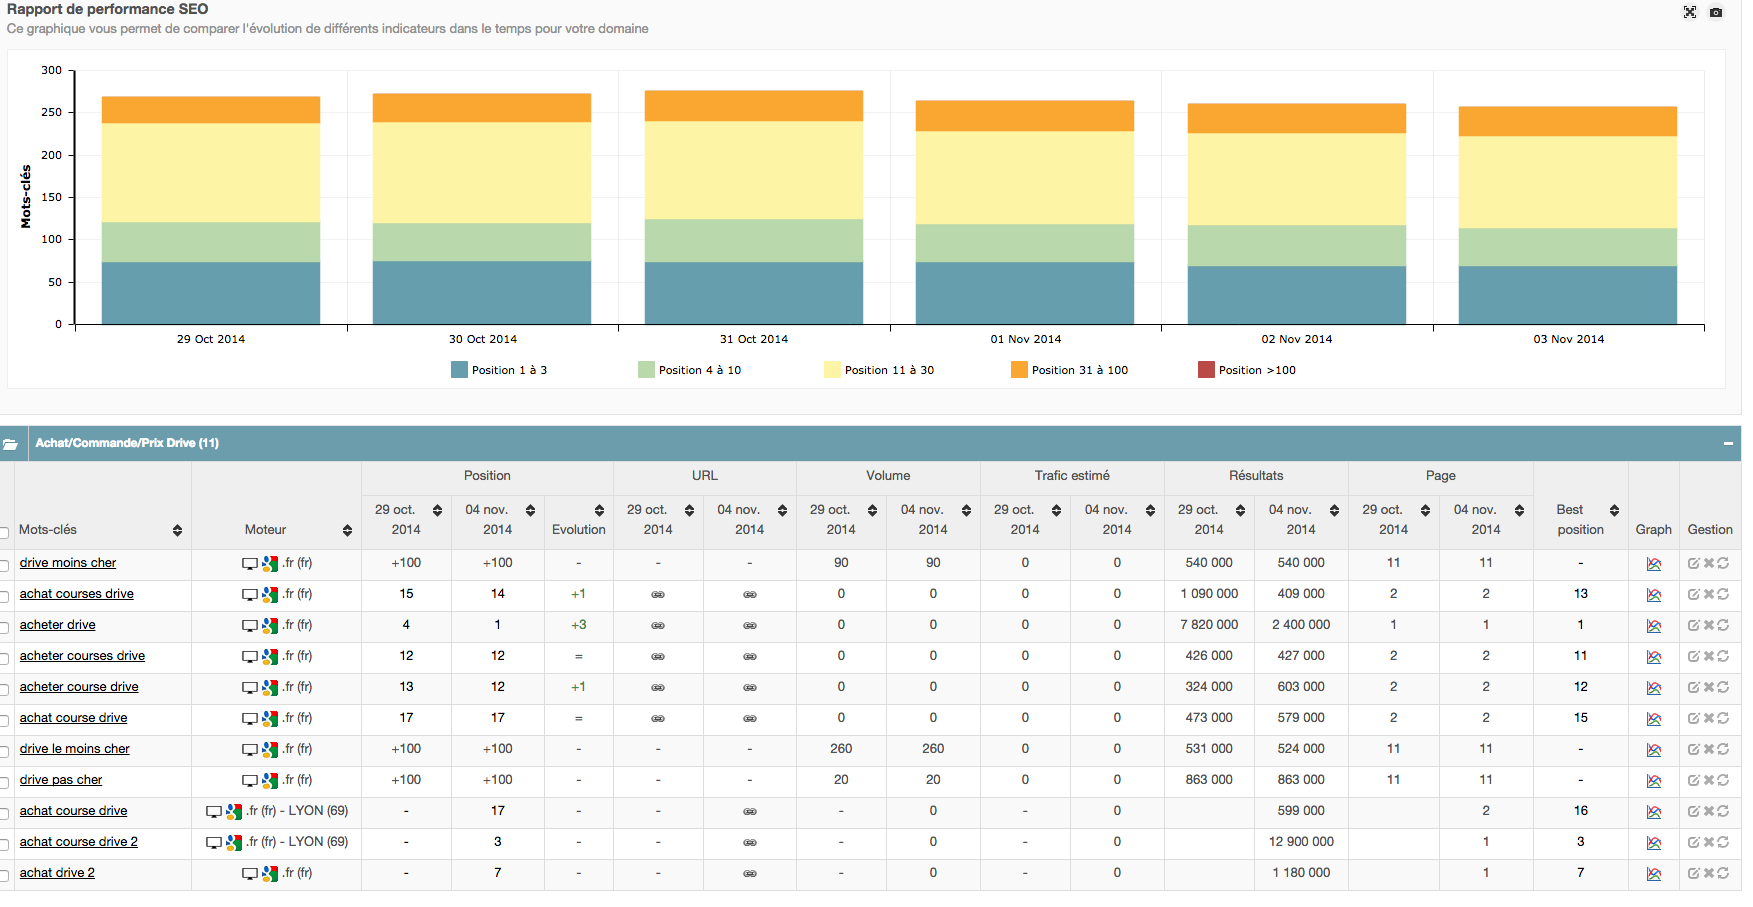
3- Rank tracking tab
The optimization of the synthesis data has been made possible by significant modifications to the rank tracking tab which is now at the heart of the tool. In addition to each table present in the rank tracking views (keywords, groups of keywords, competitors, pages, terminals, engines, location) a graph has thus been added for all views. All your data are thus visually presented and summarized at a glance and you can observe and analyse the evolution of the results.
Another new feature of this version is that all KPIs are now available on two dates for all views, and new indicators have therefore been “doubled” (volume, estimated traffic, top site etc.) thus allowing you to see the evolution of traffic or a change of page rank.
Even though the amount of information has increased, you should know that you have the possibility of hiding these indicators in the “Display” tab on the right hand side of the page. You just have to deselect a box to hide a column and to select it again for it to reappear. All your information is saved and conserved.
What has not (yet) changed
Programmed reports and exports
Your programmed exports and reports continue to work in the same way as before and will be sent as they were previously. You can also continue to create new more comprehensive ones on the basis of the new data and graphics. To update your old reports, don’t hesitate to contact our technical support.
Navigation Menu
The “Rank tracking” element of the navigation menu of the tool has not changed in the 3.7 version. Modifications have only been made for the synthesis which now displays Rank tracking / Netlinking.
Filters, groups and display
The filters are still available on the right hand side of the page by displaying the side column. You’ll find very few modifications on this point in this version.
And soon…
There will be an important new update within 3-4 weeks. We will develop a new single view that will present data of a site in relation to its competitors. We will leave you the opportunity to customize your dashboards, enabling you to integrate graphics and data for your sites. Be patient, these changes will arrive before the end of the year!
If you have any suggestions about the 3.7 version, don’t hesitate to share them with us, we remain at your service hope that you will enjoy these modifications.
Carol-Ann
Marketing manager @myposeo, community manager and writer.
- More Posts (664)