
Myposeo is happy to announce that its SEO data visualisation platform, “Local Search experience” or LSE, has gone online. It is a free new online site that allows you to analyse local ranking data for the players of 4 sectors of activity.
In this article you will discover its characteristics and how it works. Access to
the Local Search Experience platform: http://localsearch-xp.com/
The boom in local searches
Today, Google searches are divided between informational type queries (how much, how), transactional queries (buy, rent) and local queries (restaurant Paris 10th).
Today, local searches represent 46% of all traffic, compared with 25% in 2012. The development of this type of query has pushed SEO companies to deploy geolocated SEO strategies.


Already in 2014, the Google Pigeon algorithm was deployed to optimise the results for local queries. Then, in 2016, Google Opossum was released, notably to extend the results of the local pack to neighbouring areas for a geolocated query for a specific place.
That is why Myposeo wishes to accompany you with your geolocated SEO strategy, first of all thanks to our market research offer, and now with Local Search Experience.
N.B.: For more information on local SEO, do not hesitate to read our study entitled “Local SEO, a key element of the drive-to-store retail strategy”.
Collection and display of local SEO data
For your information, Local Search Experience data is collected and displayed via API calls. The information displayed in the interface comes from the data, updated every week, of our SEO monitoring tool (a campaign has been created for each player).

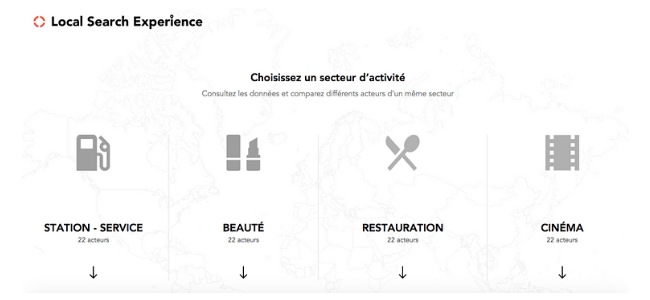
Local Search Experience allows you to know and compare the SEO ranking of the most important local players in 4 sectors:
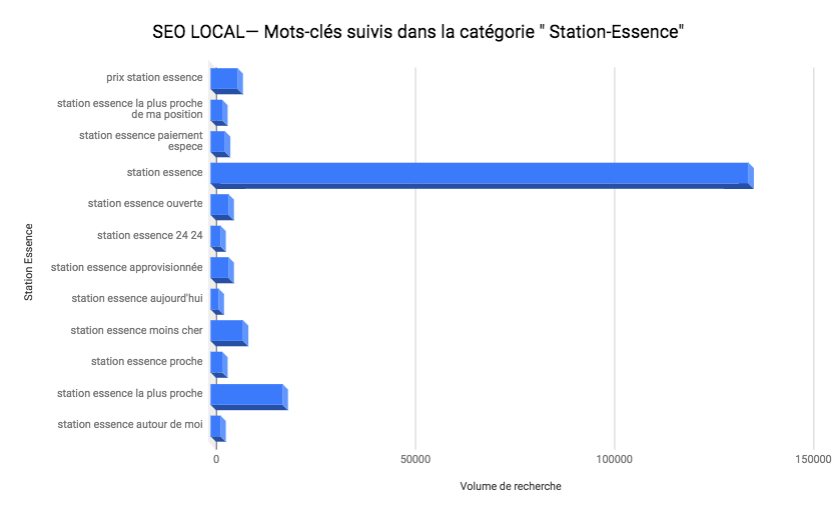
- Service stations
- Beauty
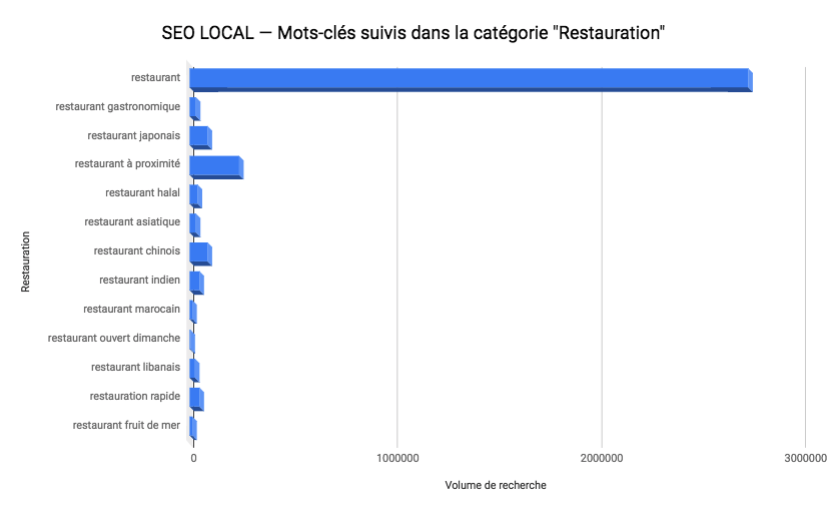
- Food
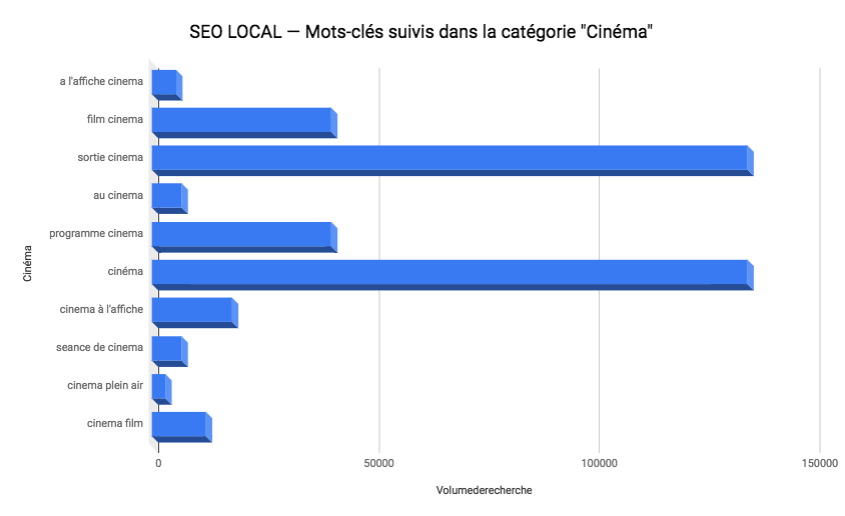
- Cinema
By selecting one of these categories, you will access an interactive map of France, which is clickable by area. You will have access to 3 views:
- National
- Regional
- Departmental
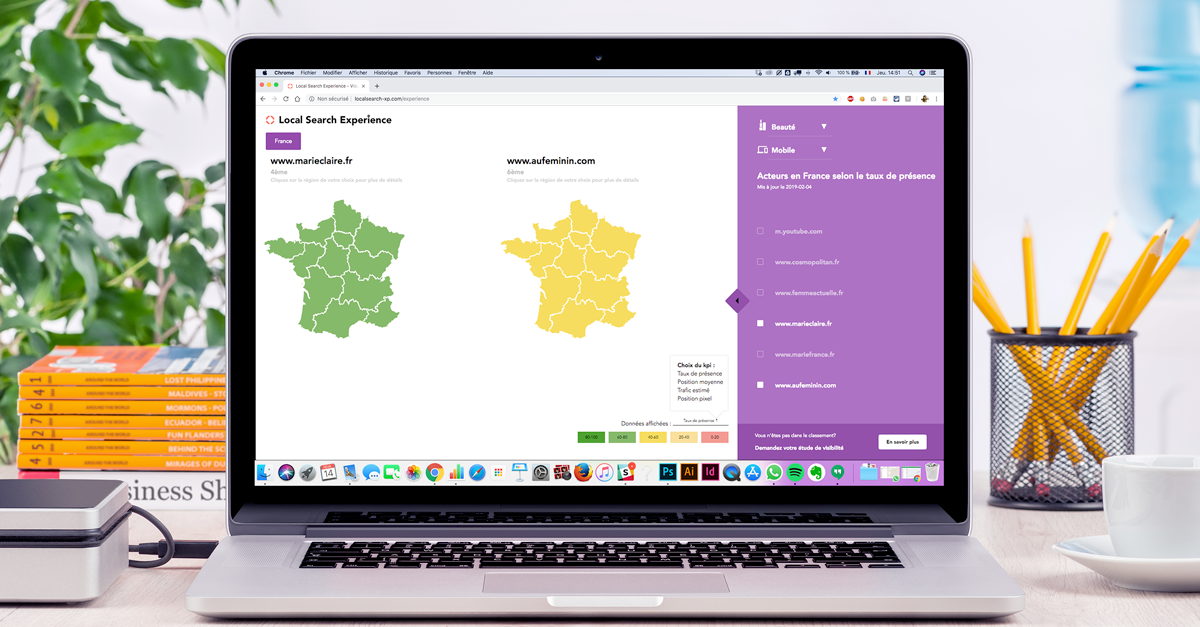
Furthermore, it is possible for you to toggle the analysis of the data between your PC and a mobile device.
Note that you can compare up to two players The 4 main indicators
The 4 main indicators
- The average rank: the average rank represents the average of ranked keywords for the site concerned. You can monitor the evolution of this indicator to know if on average the keywords have gained or lost in rank.
- Estimated SEO traffic: the estimated SEO traffic represents an estimate of the traffic generated by keyword for the site concerned. This indicator represents a trend which enables you to view the potential of the keyword based on a volume of research / position ratio
- The average Pixel position: the Pixel position is an indicator that is specific to Myposeo. It allows you to view, in a more precise way than with the position indicator, where the organic result (or Adwords) is situated on the search results page. On most screens, the average fold is located 700 px from the top of the page.
Therefore, this last main indicator allows us to know if the result is visible directly for the web user without scrolling or if, on the contrary, the result is located below the fold.
For information, the results pages of search engines are often “polluted” by other types of results (Adwords ads, Map results, etc.). Thus, it is sometimes possible to be among the Top 3 SEO positions but have little visibility. Finally, this indicator is more reliable than the SEO rank.
Note that the average Pixel position represents the average of the pixel positions of ranked keywords for the site concerned.
The other indicators
- Rate of presence: The rate of presence represents the percentage of keywords for which the site is ranked among the first 100 Google results of all the keywords monitored. This indicator enables you to follow the evolution of the SEO optimisation of a site. The goal is to be, in the long term, present on 100% of the queries of internet users regarding a topic.
- Top 1 rate of presence: the top 1 rate of presence represents the percentage of keywords on which the site is in the first position of all the keywords monitored. Given the very high click rate generated by the first position, this is an important indicator.
- Top 3 rate of presence: the top 3 rate of presence represents the percentage of keywords for which the site is ranked among the first 3 positions of all the keywords monitored. The first 3 positions are the results that obtain the most clicks in search engine results pages. It is therefore important to be visible for this indicator.
- Top 10 rate of presence: the top 10 rate of presence represents the percentage of keywords for which the site is ranked among the first 10 positions of all the keywords monitored. In addition, it enables you to highlight the percentage of keywords positioned on the first page
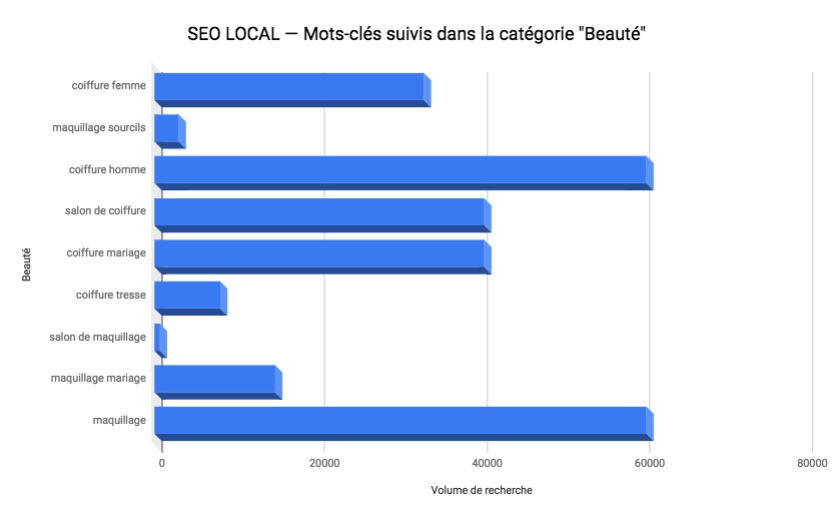
Monitored keywords
As we said above, Local Search Experience is connected to our SEO monitoring tool. For each topic, a follow-up campaign has been created with a list of keywords (high volume of research) related to the topic in 985 cities.
To conclude, updates of the interface are scheduled.
In short, we hope that LSE will be among your favourites in order to accompany you in your geolocated sector monitoring.
But if you want to go further and measure your local visibility to adapt your strategy, we invite you to send us a request for a visibility study!
PS: At the end of each month, we will prepare a short article on the top local SEO players.
Enjoy your Local Search Experience!
Carol-Ann
Marketing manager @myposeo, community manager and writer.
- More Posts (664)