

On Tuesday 5th April, we completed an important update of the myposeo “reports” tool which, just to remind you, is included with all the premium accounts regardless of the tool used.
A brief overview of this long-awaited news.
A section on our website to track updates
Originally, we suggested you to discover the myposeo updates directly in our blog in the “myposeo updates” category. However, we have developed a specific flow that you can now find on the following page:
This page will give you the detail of every major or minor update by tool category. Please take a look from time to time 🙂
Reports data board
Previously, choosing an indicator to be displayed on a board did not allow you to choose a single date on the display, and it was necessary to have two dates selected on the board:

Data update allows you to specify if you wish to display on the board a single date or both, for each indicator:
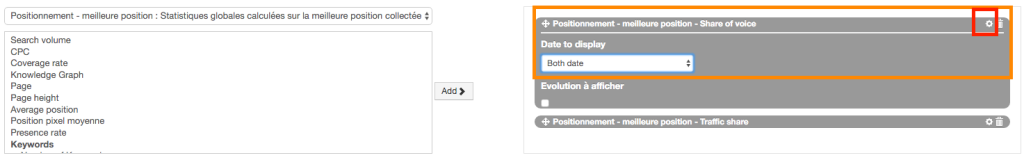
So you can fully customize the board in your reports for one or several dates. But the most interesting thing in this update is that you can now display the evolution of any indicator in real time! Previously, we were offering only the evolution of the position. You can now display the evolution of all indicators (volume between two dates, attendance rate, page height, etc.) by checking “Evolution to be displayed“.
See all the news on the boards.
Temporality blocks reports
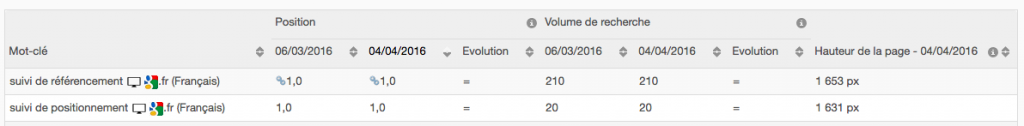
Reports can be displayed for one date or for between 2 dates through the calendar at the top right of each. By default, in the previous version, the graph an all the blocks followed the global temporality of the calendar selected at the top of page. Here for example a scorecard displayed between two dates:
![]()
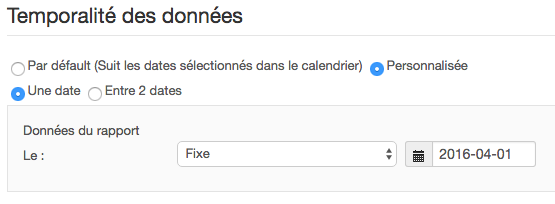
The new version allows you to set a default global temporality for the report and then configure a different temporality for a particular block if you wish.
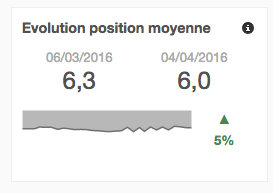
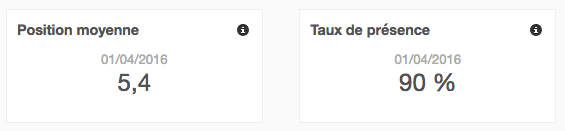
We can therefore display fixed data for a date, such as the average position or attendance rate for example:
This evolution presents the big advantage of being able to display data “relative” to dates 1 and 2 and so always getting information in your reports when you use Google Analytics or Google Search Console, which allows to display data respectively only to D-1 and D-3 (data not being made available by Google in real time for the audience or the traffic keywords).
See all the news on data temporality.
New original graphs for the shaping
Data-visualisation is increasingly important in reports to be able to understand performance evolution at a glance. That is why we have added 8 additional graphics formats, including 5 for displaying data on one date and 3 to display an evolution in time. These include the following graph that allows you to see the number of keywords up or down every day:

See the detail of all new graphics.
Advanced colour custimisation in your reports
If visualisation of graphic is important, it is clear that report colorimetry also is. Previously, we offered a set of default colours but it is now possible to personalise fully all the graph colours for each set of data. It is also possible to create templates of colours for your report and to find these when selecting colours for each set of data.

An evolution that will allow you to apply colours according to the customers for whom you send reports!
See the detail of report colours customisation.
Video : report creation
If you have not yet started the creation of a report, we invite you to look again at our short presentation video (tutorial) to familiarise yourself:
We hope that you will be delighted by all these evolutions and would love to hear your opinions!
Carol-Ann
Marketing manager @myposeo, community manager and writer.
- More Posts (664)